Monitoring#
Since training can take quite some time and the hacks used in SoulsGym aren’t 100% stable, we integrate a live monitoring service to detect active clients, the current sampling rate, update times, and the status of the server nodes. We also include the training results to check the agent’s performance.
Grafana#
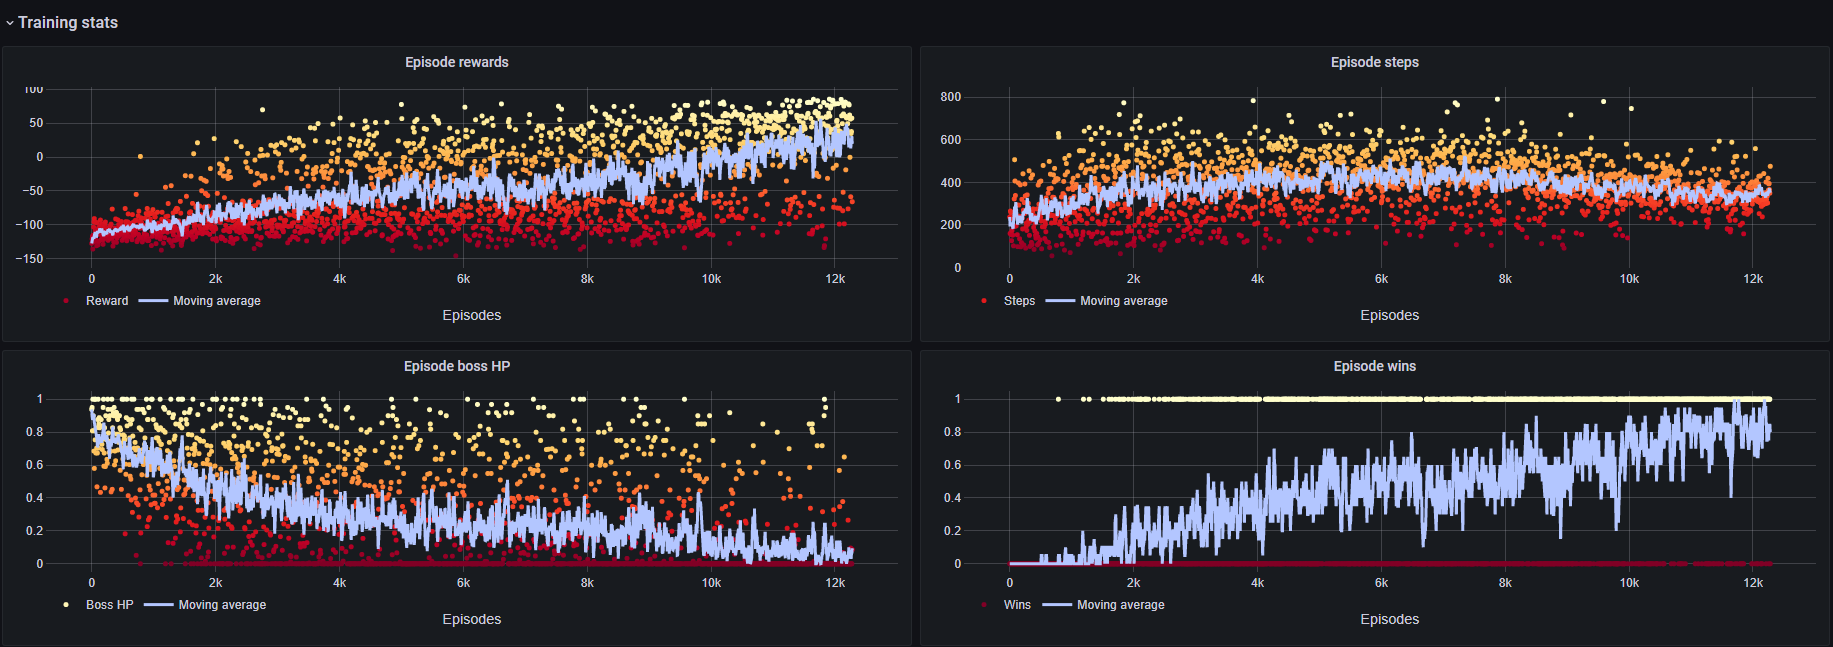
We use Grafana as a web interface for live monitoring of the training process. To plot the agent’s performance, we use the plotly integration and the custom Grafana connector from the telemetry node.
Prometheus#
Both the training node and the telemetry node are surveilled by Prometheus. In addition, it tracks the number of active clients, the model update times, and the total sample count. This information can then conveniently be displayed in Grafana.
Docker networks#
The monitoring stack runs in its own docker compose environment. To reach the training and telemetry server for live monitoring, the stack requires a second docker network, server.